What's included in the diagram
The interface for Live Trace Explorer includes a diagram with an overall Trace Score. The diagram consists of tiles that represent containers generated from the project tree, and trace paths that indicate the status of the relationships between the tiles.
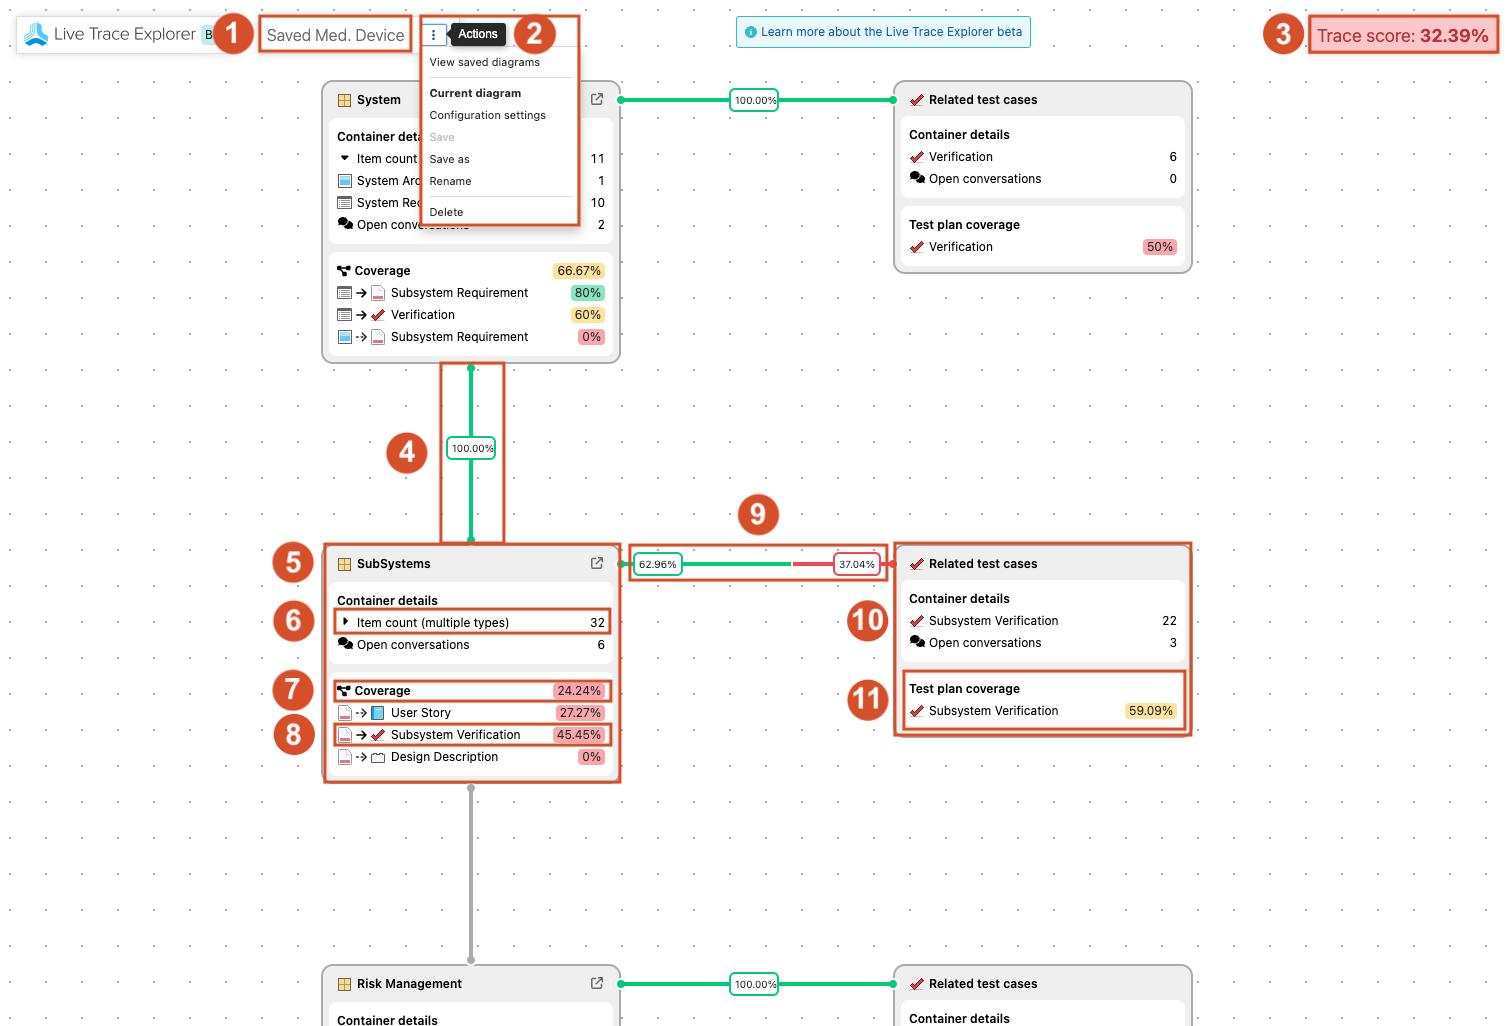
Diagram name — The name of your project or container (project, set, or component) that generated the diagram.
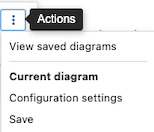
Actions menu — Access to the Configure Settings panel, where you can change the diagram by enabling or disabling item types and relationships.
Your role and permissions determine which options are available from the Actions menu. For example, if you are the diagram owner, you can rename, delete, and save new default configurations for the current diagram. If you aren't the diagram owner, the available options are more limited:
For more information about the Live Trace Explorer roles and permissions, see Jama Connect Live Trace Explorer.
Trace Score — The overall percentage (0–100%) of the expected relationships and items in the diagram.
Related test case tile — Container for all test cases related to the paired specification tile.
Specification tile — The container with coverage details for a specific item or relationship.
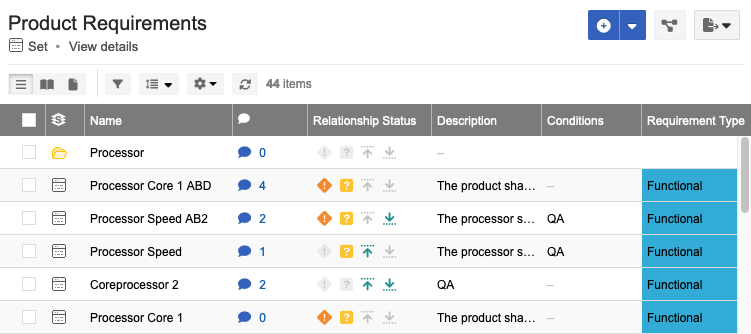
Items — The list of items and counts that make up the content of a tile. Selecting an item from the list provides access to List View, which lists all items from the specification tile. From there, you can navigate to Single Item View to update and add relationships as needed.
Total coverage per tile — The sum of all individual relationship rule coverages. Helps you quickly identify which tiles and containers need attention.
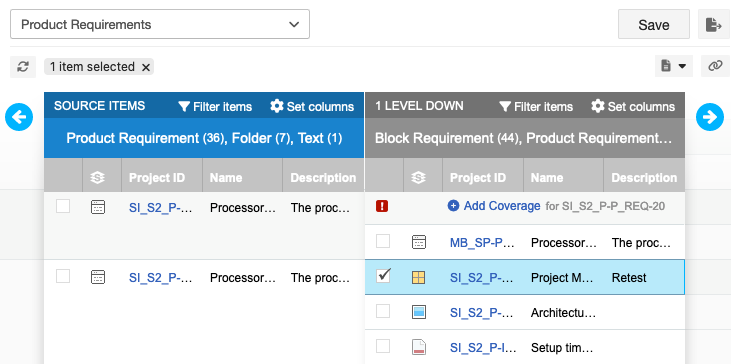
Coverage relationship rules — Shows the coverage percentage for each relationship rule. Click a rule to access Trace View, which is filtered to this specific set of items. Update and add relationships as needed.
Vertical trace path — The percentage of valid (green) or suspect (red) relationships between items in the two connected tiles. A gray line indicates no relationships exist. Hover over the percentage to reveal the number of valid or suspect relationships.
Horizontal trace path — The percentage of valid (green) or suspect (red) relationships between the specification tile and any of its related test cases. A gray line indicates no relationships exist. Hover over the percentage to reveal the number of valid or suspect relationships.
Test plan coverage — A test case is covered when it belongs to a test plan.