Trace View Canvas interface (Beta)
Trace View Canvas displays item relationships in an interactive graph.
Note
The ability to export will be available in a future release.
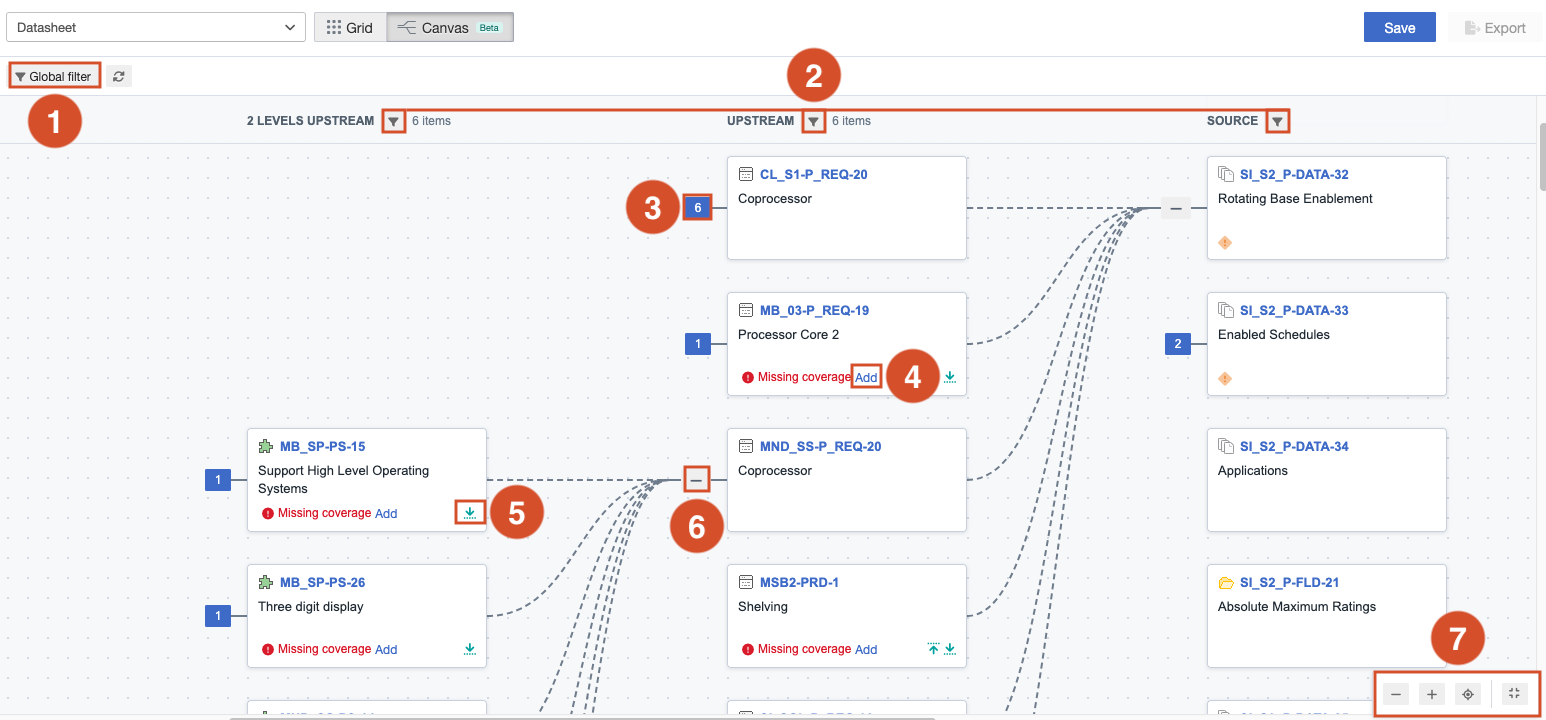
Create a global filter that refines tiles to match filter conditions.
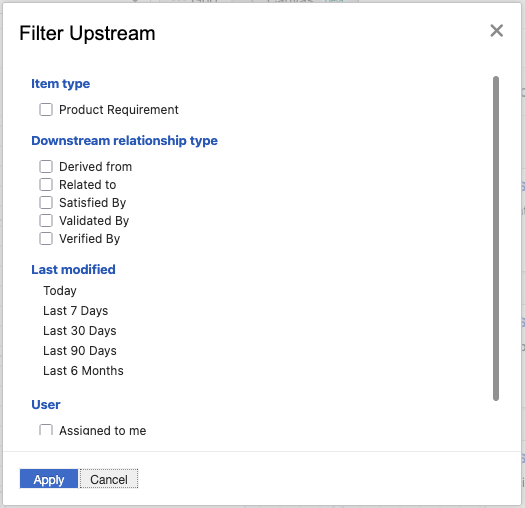
To refine your results, filter items by Item type, Downstream relationship type, User, and Last modified.
Select the button next to a tile to view that item’s relationships. The number indicates how many downstream items it has.
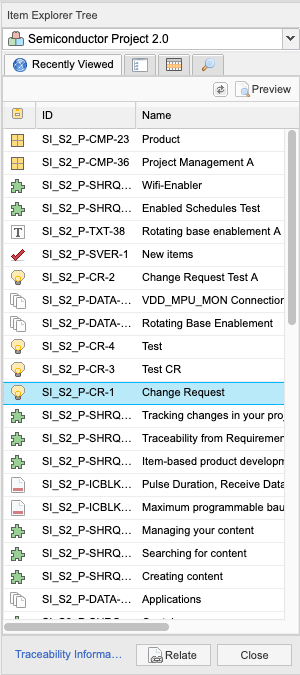
Add missing coverage by opening the Item Explorer Tree panel, where you can relate items to fill coverage gaps.
View upstream and downstream relationships.
Collapse relationships.
Pan and zoom the canvas.