View and configure logging
Log files record information from the application and can help with troubleshooting. Information is captured in the contour.log file.
Entries in the log file are noted by the [jama.AccessLog] package and include this information:
Date of request
Server processing time to handle the request
The user who submitted the request
The organization ID of the user who submitted the request
The user session ID of the user who made the request
The server address that the request was made to
Enabling the profiler logging enhances logging in Jama Connect. However, profiler logging might require additional resources to generate this content. For best performance, use the profiler for troubleshooting purposes.
The profiler prints out the following information:
User who submitted the call
Organization the user belongs to
Java thread ID of the call
Stack trace of the call that includes processing time and memory usage of each trace
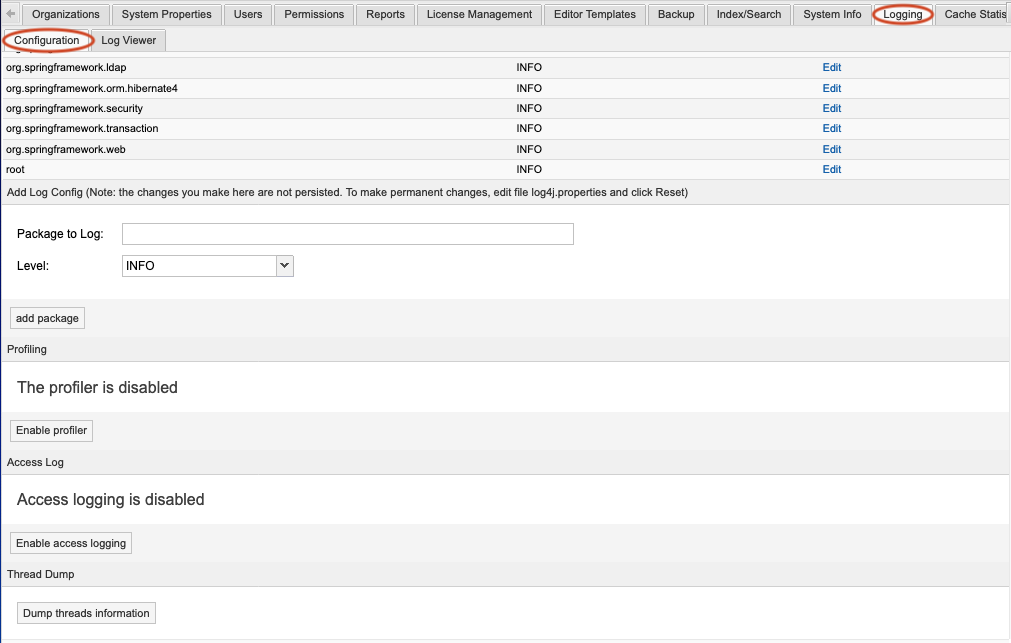
To view the log and configure logging:
Select Logging > Log Viewer to view the log. As needed, select Refresh at the top right to refresh the log.
Select Logging > Configuration.
Tip
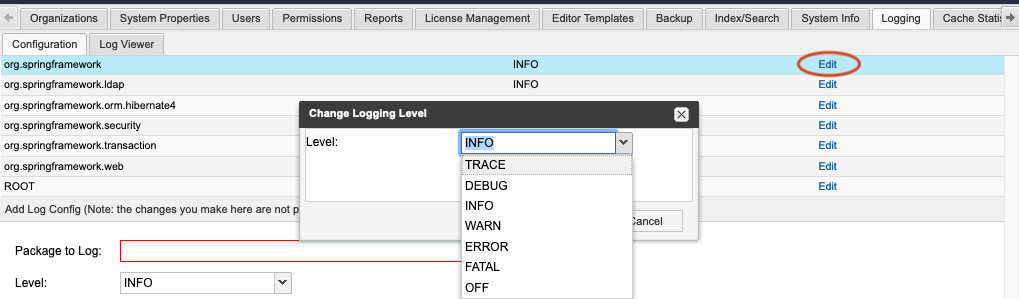
By default all logging levels are set to Info and reset to that default when the application is restarted.
To permanently change the logging level and appenders, edit the file:
/data/config/log4j.properties
The log configuration for OpenSearch and search service can also be found in:
/data/config
You cannot change the location to where log files are written. Changes to these configuration files are applied within a few seconds and are persisted across restarts the application.
To change the logging level from the default setting of Info, select Edit.
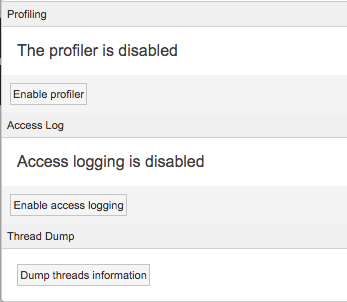
To log additional content for every log entry in the contour.log file, scroll to Profiling at the bottom of the page and select Enable profiler.
Profiling is indicated in the log file as the [jama.Profiler] package.
Here is a sample log entry:
2011-04-28 09:37:19,865 INFO [org.directwebremoting.impl.DefaultRemoter] - Exec: projectSvc.getExtTreeNodeForProject()
2011-04-28 09:37:19,869 INFO [jama.Profiler] - user:admin org:2 thread:96 start:2011-04-28 09:37:19,866
[3ms] [+88K/-88K 837755K/254041K]- com.jamasoftware.Jama.dwr.impl.DwrProjectServiceImpl.getExtTreeNodeForProject
[3ms] [+88K/-88K 837755K/254041K]- com.jamasoftware.contour.service.impl.ProjectServiceImpl.getExtTreeNodeForProject
[2ms] [+88K/-88K 837755K/254041K]- com.jamasoftware.contour.service.impl.DocumentTypeServiceImpl.getAvailableDocumentTypesForProject
To capture information for all user requests and all locked-out users in Jama Connect, select Access log, then select Enable access logging.
Information is captured in the contour.log file. Here is a sample log entry:
2014-08-29 16:24:59,370 INFO http-bio-8080-exec-17 [jama.AccessLog] - [3 ms] PRBDIJN9 1 - 083BBE5B1E8C481033DA7AFBBEF023A5 160 http://localhost:8080/contour/
To capture a one-time dump of the current running java threads being executed, select Dump threads information under Thread dump.
Information is captured in contour-threaddump.log.
If Jama Connect seems to hang, run a thread dump and send the log file to support@jamasoftware.com.
Use the captured information for troubleshooting, for example to identify long running processes.